
The US freight market enters November with tighter truck capacity and spot rates above last year’s levels. Holiday restocking supports freight activity, while high operating costs pressure smaller carriers.
Elevated diesel prices, rising insurance expenses, and equipment cost uncertainty influence fleet investment decisions.
Executive Summary
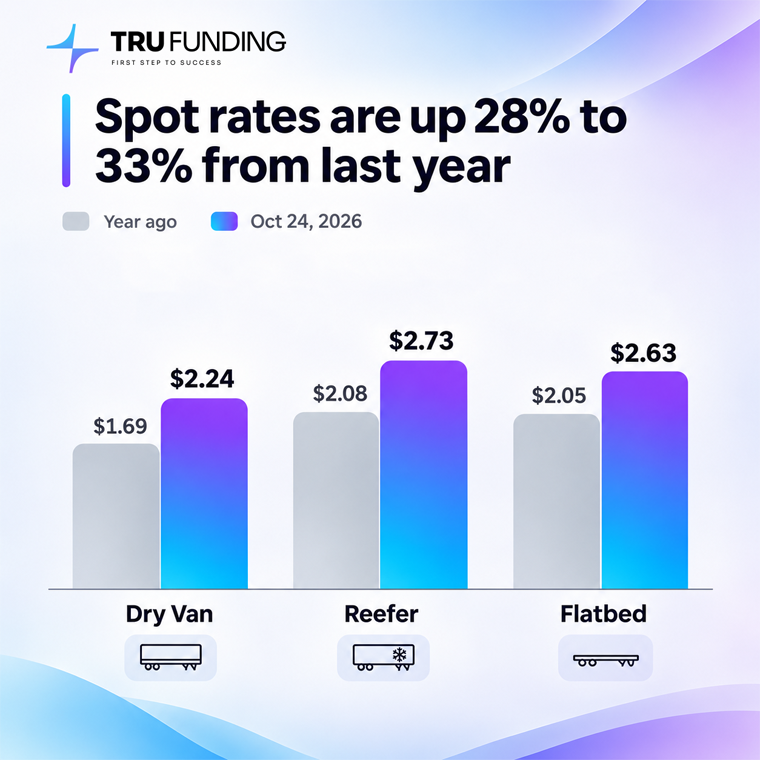
- Freight rates remain strong: Dry van spot linehaul averaged $2.23/mile in late October, up 32.6% year over year. Reefer and flatbed rates increased more than 28%.
- Truck capacity tightens as seasonal demand increases: October’s Logistics Managers’ Index reached 70.7 amid holiday inventory rebuilding. DAT reported 26.1% fewer dry van truck posts year over year.
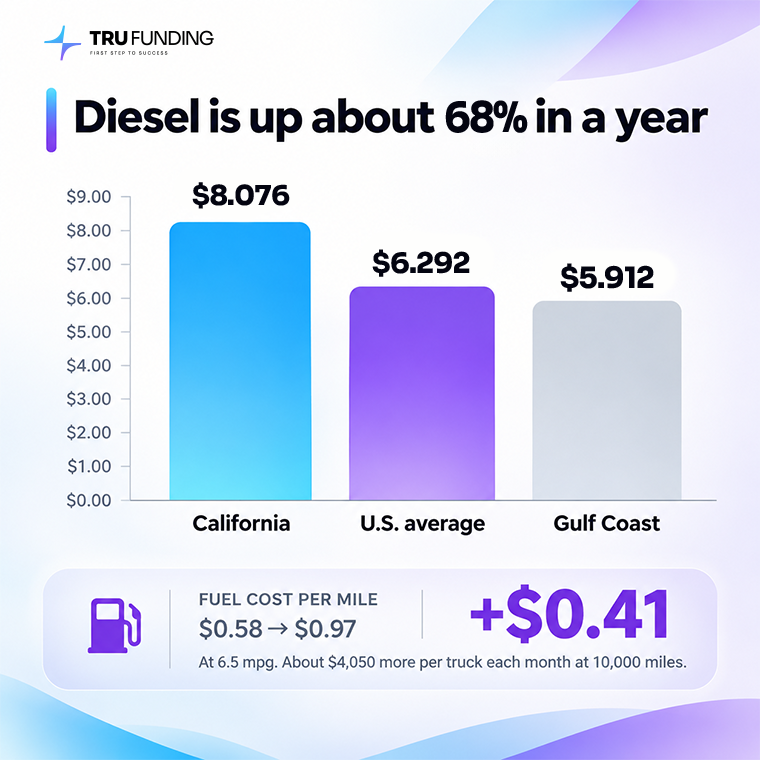
- Operating costs pressure carrier finances: Diesel averaged $6.29/gallon on November 2, approximately 68% higher year over year. Insurance expenses and equipment financing obligations increase financial pressure.
1. Market Overview
Freight Rates: Strong Year-Over-Year Growth
National average spot linehaul rates for the week ending October 31 exceeded last year’s levels, according to DAT Freight & Analytics.
| Equipment type | Rate per mile | Year-over-year change |
| Dry Van | $2.24 | +32.8% |
| Reefer | $2.73 | +31.4% |
| Flatbed | $2.63 | +28.2% |
Higher freight rates do not guarantee stronger carrier margins. Fuel-inclusive rates can increase alongside diesel costs without proportional profitability gains.
Freight Demand and Capacity
Truck capacity tightens as seasonal freight activity increases.
DAT reported dry van load posts up 26.8% year over year, while truck posts declined 26.1%. The load-to-truck ratio reached 10.93, compared with 6.37 a year earlier.
Flatbed capacity remained tight, with approximately 41.7 posted loads per available truck.
TRU Funding analyzed October’s Logistics Managers’ Index (LMI), which shows retailers rebuilding inventories ahead of the holiday shopping season.
The overall index reached 70.7, while Inventory Levels increased eight points to 66.9.
Transportation Capacity registered 38.0, indicating contraction, while Transportation Prices reached 88.0, signaling upward pricing pressure.
The latest available Cass Freight Index recorded a 1.9% year-over-year increase in September shipments, indicating higher shipment volumes than a year earlier.
Holiday restocking supports freight activity, while limited truck availability strengthens carrier negotiating power.
Regional differences remain substantial. DAT reported average dry van linehaul rates of $2.62/mile for California origins, compared with $1.34/mile for Florida and South Georgia origins.
Carriers should evaluate individual freight lanes rather than relying on national averages when negotiating rates
.
Fuel: Major Operating Cost Pressure
The national average diesel price reached $6.292/gallon on November 2, approximately 68% higher year over year, according to the EIA.
Diesel averaged $8.076/gallon in California, compared with $5.912/gallon along the Gulf Coast.
At 6.5 mpg, diesel costs approximately $0.97/mile, compared with $0.58/mile a year earlier.
Fuel expenses increased approximately $0.39/mile, before accounting for higher freight rates or fuel adjustments.
2. Financial Implications for Trucking Businesses
Profit Margins: Higher Rates Do Not Guarantee Higher Profits
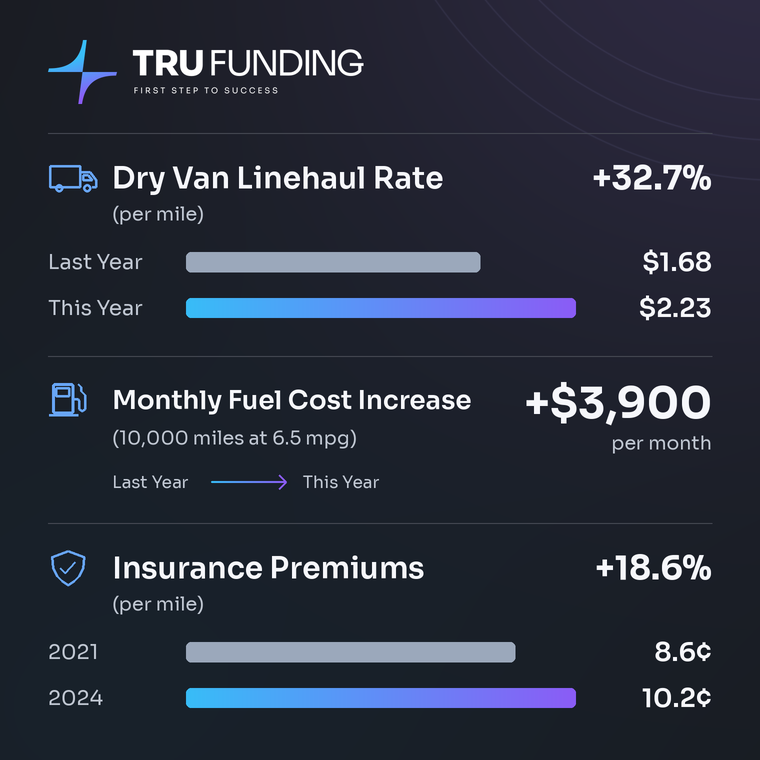
A dry van linehaul rate of $2.23/mile exceeds last year’s $1.68/mile, but higher operating expenses can reduce profitability gains.
A truck traveling 10,000 miles monthly at 6.5 mpg would incur approximately $3,900 more in monthly fuel expenses than a year earlier.
TRU Funding’s review of trucking insurance trends identifies rising premiums as a growing concern for smaller carriers. According to the American Transportation Research Institute (ATRI), commercial auto liability insurance premiums increased 18.6% per mile between 2021 and 2024, reaching 10.2 cents per mile.
Carriers must include maintenance expenses and equipment financing obligations when calculating profitability.
Empty miles and regional cost differences can turn high-paying freight into low-margin loads.
Smaller fleets should prioritize profit per load over freight rates per mile.
Cash Flow: Higher Working Capital Requirements
Higher operating costs increase carriers’ working capital requirements.
Carriers purchase fuel during transportation but may receive payment weeks after delivery. Rising expenses increase cash requirements between payments.
When invoices remain unpaid for 30 days or longer, multi-truck fleets must continue covering fuel, payroll, and equipment expenses without receiving payment for completed loads.
Carriers should compare expected payments against upcoming fuel, payroll, insurance, and equipment obligations.
Invoice factoring can help bridge cash flow gaps when financing fees and terms align with business needs.
Accounts Receivable: Evaluate Broker Payment Reliability
Tighter truck capacity may strengthen rate negotiations, but payment risks remain.
Knight-Swift reported reducing its approved brokerage carrier pool by approximately 70% over two years through stricter carrier screening requirements.
The reduction primarily reflects stronger safety and fraud-prevention standards and indicates increasingly selective freight access through larger brokers.
Carriers should verify broker creditworthiness, review payment history, and avoid concentrating unpaid freight with individual customers.
Higher-paying loads offer limited financial benefit when invoices face disputes or delayed payments.
TRU Funding’s perspective: Limited truck availability may help carriers negotiate higher rates on certain lanes. Profitability depends on covering operating costs and collecting invoices on time. Monitoring outstanding payments supports cash flow alongside freight rate negotiations.
3. Trucks and Transport Equipment
New Equipment: Orders Decline Amid Regulatory Uncertainty
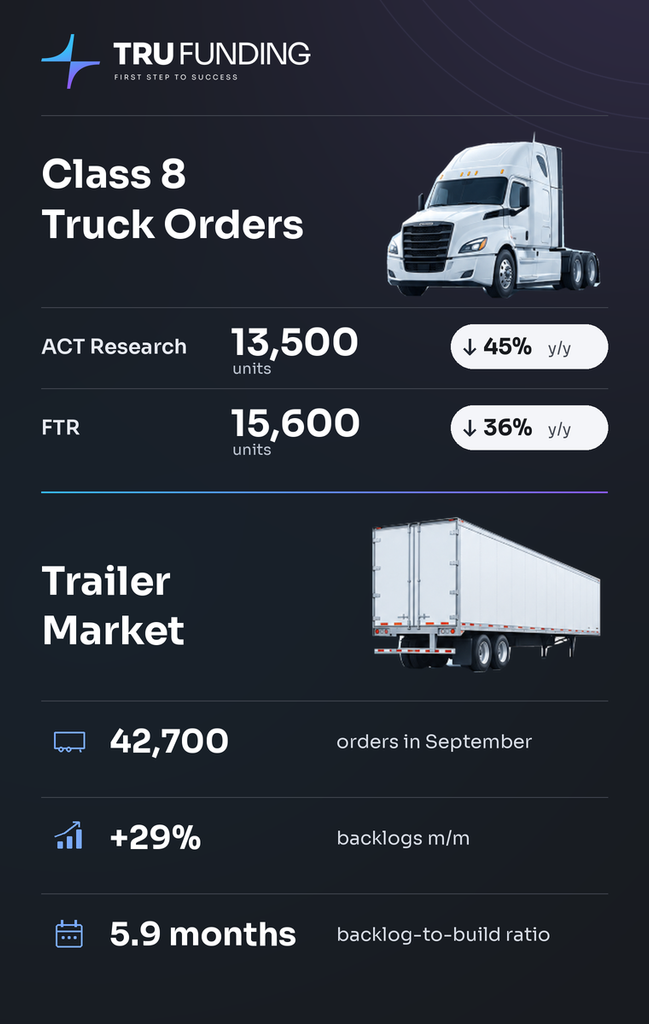
Preliminary October Class 8 truck orders declined sharply.
ACT Research reported 13,500 units, down 45% year over year, while FTR estimated 15,600 units, down 36%.
Both estimates indicate fewer Class 8 truck orders than a year earlier. Uncertainty about 2027 emissions regulations and equipment pricing may influence fleet purchasing decisions.
ACT Research reported approximately 42,700 trailer orders in September, supported partly by replacement demand and concerns about potential tariff-related price increases.
Industry trailer backlogs increased 29% month over month, while the backlog-to-build ratio reached 5.9 months.
Truck orders declined, while trailer replacement activity remained comparatively strong.
Used Trucks: Higher Prices and Limited Inventory
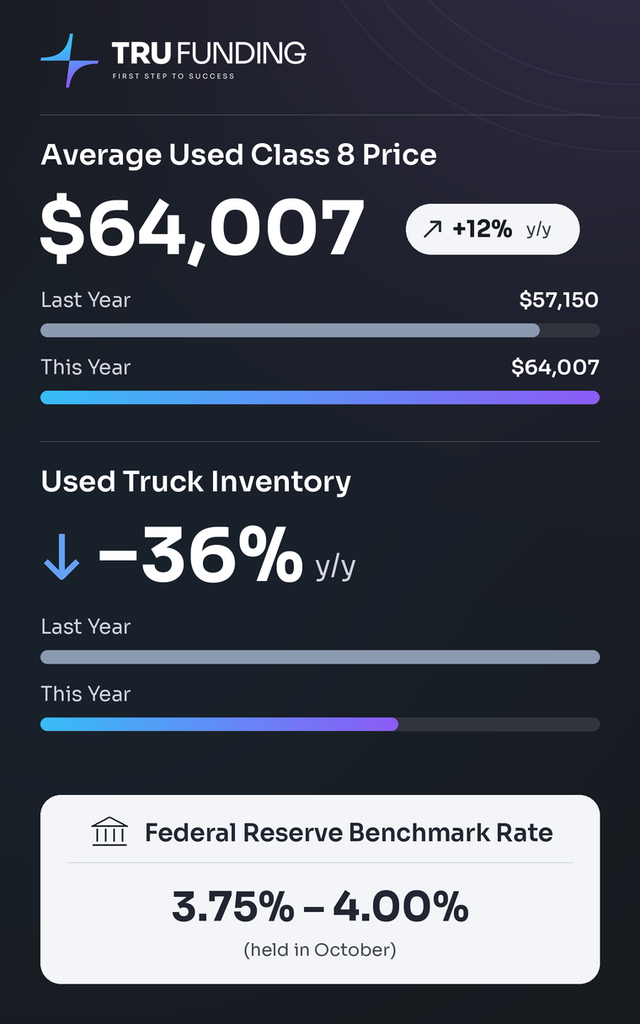
Average used Class 8 retail prices reached $64,007 in September, approximately 12% higher year over year, according to ACT Research.
Sandhills Global reported used heavy-duty truck inventory down approximately 36% year over year across its tracked marketplaces.
Limited equipment availability may support resale values but increases fleet replacement and expansion costs.
The Federal Reserve held its benchmark interest rate at 3.75–4.00% in October, following a September increase.
Individual loan rates vary, but borrowing costs affect monthly payments and total equipment purchasing expenses.
Before purchasing trucks, carriers should compare financing rates, repayment obligations, expected revenue, and fleet utilization.
Higher freight rates alone do not justify fleet expansion. Equipment purchases should align with realistic freight demand and available cash.
4. November 2026 Freight Market Outlook
Freight Rate Forecast
Freight rates could remain firm during the holiday shipping season, supported by limited truck availability and seasonal inventory restocking.
| Equipment | Latest | Forecast |
| Dry Van | $2.24 | ~$2.27 |
| Reefer | $2.73 | ~$2.75 |
| Flatbed | $2.63 | ~$2.62 |
DAT projects a three-cent increase in dry van rates, supported by retail and e-commerce restocking before Black Friday and Cyber Monday.
Reefer rates could increase approximately two cents amid stronger holiday demand for produce, dairy, and other perishables.
Flatbed rates are projected to decline one cent as construction and industrial shipments typically slow around Thanksgiving.
These forecasts represent modest expected changes. Actual freight pricing will depend on regional demand and available truck capacity.
Carrier Priorities for November
1. Recalculate operating costs.
Use actual truck fuel economy and regional diesel prices when evaluating loads. Include empty miles, insurance, maintenance, and other operating expenses when calculating profitability.
2. Protect accounts receivable and cash flow.
Review broker payment histories before accepting unfamiliar loads. Track overdue invoices and monitor cash tied up in completed but unpaid freight.
3. Evaluate equipment purchases carefully.
Higher freight rates do not automatically justify fleet expansion. Compare financing costs, expected utilization, and available working capital before purchasing equipment.
Final Takeaway
The US freight market enters November with stronger rates, tighter truck capacity, and increasing seasonal freight activity. Elevated operating costs and equipment price uncertainty continue to pressure smaller carriers.
Trucking companies should prioritize converting higher freight rates into stronger profit margins and reliable cash flow.